New Dare Flood Maps Misrepresent Risk
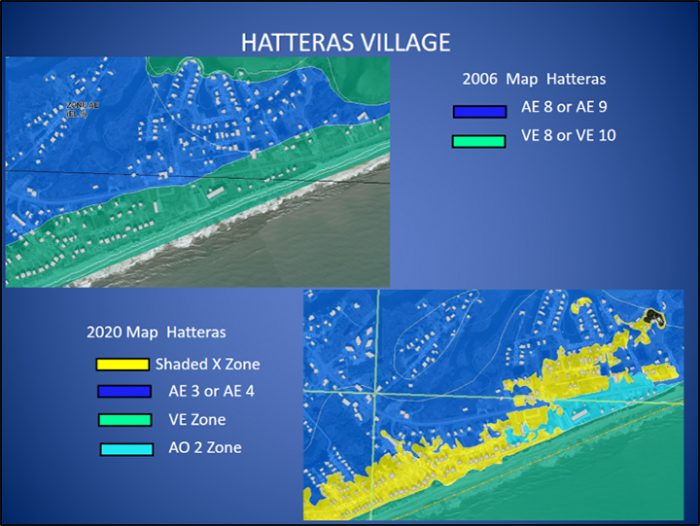
The disconnect between current flooding reality and the newly released floodplain maps in Dare County, which decrease flood zones by 41%, may be starker than most coastal areas in North Carolina because of the barrier islands’ geology.
But much of the disparity between actual vulnerability and the flood risk reflected in Dare’s pending flood maps relates the timing of data collection and a different interpretation of oceanfront storm surge.
Whatever the reason, the dramatic changes in the updated maps misrepresent the flood risk for property owners in unincorporated Dare County and its six towns, said Dare County Planning Director Donna Creef.
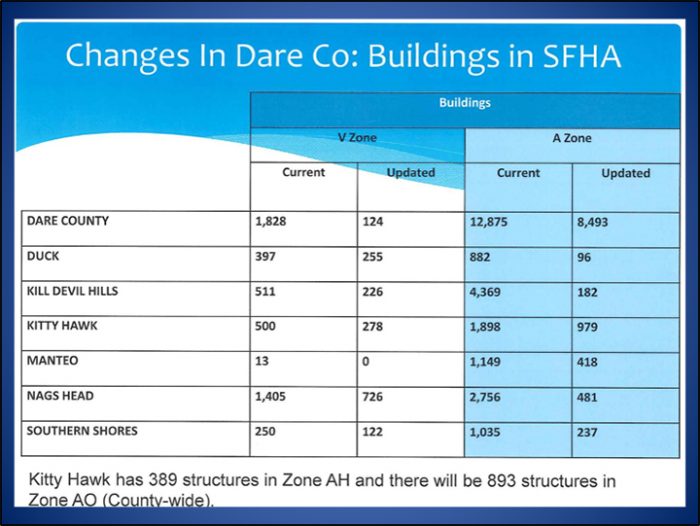
Of the county’s 12,875 properties, the VE, or high-velocity areas such as the oceanfront, will soon number 124 properties, compared with the 1,828 currently, according to a presentation Creef gave to the Dare County Board of Commissioners during its Jan. 6 meeting. Many VE properties will be moved to AE flood zones, which are classified at 4 feet or 8 feet of base flood elevation. In addition, she said, the revised maps decrease current AE zone properties from 12,875 to 8,493. Also, 2,890 properties have been reclassified as shaded X and X zones that do not require federal flood insurance.
Creef said that when the maps are effective June 19, flood insurance rates will be based on the new maps. That could be a problem if people drop policies, even though their property is still subject to the same risk of flooding.
“Our concerns are legitimate concerns,” Creef said.
The county plans to put a local ordinance in place with appropriate elevation standards for properties in flood areas.
“Houses that have built since 2006 are elevated to levels that did not flood in Hurricane Irene,” she said. “That’s a good benchmark for us.”
But at this point, since the maps are not going to change, and their implementation is certain, the county has stepped up its outreach to citizens with its “Low Risk” is not “No Risk” initiative, including on its website. It is also working with local real estate companies and other community groups to get the word out.
“We’re committed to this,” she said.
Currituck County also had a lot of its properties that were formerly in flood zones moved out of flood zones, said Jason Litteral, the county’s floodplain manager.
A number of oceanfront properties in Corolla and Carova are no longer in flood risk areas, he said, and there wasn’t any transition in the way they were reclassified.
“It just went straight from the worst flood zone to the best one,” he said. “It’s a little odd, obviously, in the climate we are in right now, to reduce the flood zone requirements. It’s kind of counterintuitive.”
The floodplain program covers the county’s 29-mile ocean coastline and 93.5 miles of riverine shoreline. The new maps, which were finalized in December 2018, had a 89.5% decrease in V zone and a 24.75% increase in A zone properties.
Another impact of the map changes is that much of the property in Carova that is in special Coastal Barrier Resource Act, or CBRA, zones, where federal flood insurance is not available to property owners, will no longer have to carry flood insurance. Despite some concern that it would result in a building boom in flood zones, Litteral said that had not happened. Nor had people in other former flood zones given up their policies en masse.
“We feared that everyone was going to drop their insurance immediately,” he said. “But it’s been nowhere what we anticipated.”
The state was required to use the approved Federal Emergency Management Agency standards and guidelines in creating the updated maps, said Randy Mundt, outreach coordinator with the North Carolina Emergency Management flood mapping section. And the new maps are accurate in that context, he added.
“The coastal flooding processes for FEMA’s models that are required to be used do not factor in rainfall,” Mundt explained. “They only factor storm surge and wave action associated with coastal storm events.”
But the maps, which are updated every 10 years or so, have different levels of accuracy in different parts of the state. And Dare County has a dynamic coastline that is more vulnerable to the effects of changing sea levels than the rest of the state.
“All modeling has to be based on existing data when we initiate the study,” Tom Langan, Engineering Supervisor North Carolina Emergency Management flood mapping section, explained in a recent telephone interview.
Since the storm surge modeling started around 2010, data from hurricanes Irene in August 2011, Matthew in September 2016, or Florence in September 2018, were not included. But those storms created significant flooding and/or storm surge on the Outer Banks.
Prior to the new maps, Dare’s flood maps had used a 1981 surge study as the base for its updated wave modeling. In the old model, surge primarily looked at wave action, while the new maps look at the influence of the primary frontal dune on the wave action. Rather than the paper topographical maps, the new coastal study used digital LIDAR, or light detection and ranging, which provides more accurate ground elevations.
The state is encouraging communities to use their own experience and expertise to set appropriate flood zone standards.
“Flood risk is not uniform across the United States, nor in North Carolina,” Mundt said. “If you think you’re in an area that is flood prone, you should maintain or purchase flood insurance.”


