By JOY CRIST
Does it seem a little early in the year to be discussing hurricanes? You betcha.
But in early March, NOAA?s National Hurricane Center (NHC) released a detailed list of changes to their ?products and services? for the upcoming 2017 storm season. In other words, these are changes to the information and graphics that we all obsessively peruse on the NHC website whenever a named storm is out in the Atlantic waters.
And some of these changes are indicative of the shift that?s been occurring over the past several years from a focus on wind speed, to a focus on storm surge instead.
As everyone on Hatteras and Ocracoke Island knows, it?s the storm surge ? or the flood of water that pours in like a bulldozer ? that causes the most damage during a storm, and the NHC has been actively finding ways to forecast the likelihood of storm surge, and to share this information with the public.
In May of 2016, Jamie Rhome – the man who oversees the National Hurricane Center?s Storm Surge Unit and who is blazing a trail with new forecasting methods ? spoke at a public meeting in Buxton to discuss the importance of storm surge when watching for potential effects of an upcoming storm.
?If you don?t take away anything else ? if you want to go to sleep for the rest of the [meeting] ? remember this,? said Rhome at the 2016 event. ?The Saffir-Simpson scale is not the weapon of choice to determine your vulnerability… It?s storm surge that does the damage.?
With this in mind, the NHC website has added a wealth of storm surge information in the past several years, and essentially, these updates are continuing for 2017.
One of the coolest features in this wave of recent developments was the launch of the interactive storm surge maps, formally known as the ?Potential Storm Surge Flooding Maps.? Found alongside the other tracking information, maps, graphs, and reports on the NOAA / NHC website for each individual hurricane, these new interactive maps highlight storm surge probability, and are posted with the first hurricane watch for a specific storm. The prototype of the interactive maps was created during 2014?s Hurricane Arthur, and since then, they have become a resource for media and individuals alike in coastal areas.
In addition to the interactive storm surge maps ? which are already up and running ? this latest NHC announcement of 2017 updates features a wave of changes that will continue to put storm surge in the spotlight.
New Storm Surge Watch/Warning becomes operational
Beginning with the 2017 hurricane season, the National Weather Service (NWS) will issue storm surge watches and warnings to highlight areas along the Gulf and Atlantic that have a significant risk of life-threatening inundation from a tropical cyclone, subtropical cyclone, post-tropical cyclone, or – (pending final NWS approval) – a potential tropical cyclone.
The storm surge watch/warning areas are determined by a collaborative process between the NHC and local NWS Weather Forecast Offices (WFOs). The primary objective guidance will be ?P-Surge,? an ensemble-based probabilistic system driven by the SLOSH model, the latest NHC official tropical cyclone forecast, and the typical historical errors associated with NHC forecasts. Forecaster confidence, continuity from advisory to advisory, and other subjective factors will also help determine the areas placed under a watch or warning.
The definitions for the new storm surge watch and warning per the NHC are as follows:
Storm Surge Watch: The possibility of life-threatening inundation from rising water moving inland from the shoreline somewhere within the specified area, generally within 48 hours, in association with an ongoing or potential tropical cyclone, a subtropical cyclone, or a post-tropical cyclone. The watch may be issued earlier when other conditions, such as the onset of tropical storm-force winds, are expected to limit the time available to take protective actions for surge (e.g., evacuations). The watch may also be issued for locations not expected to receive life-threatening inundation, but which could potentially be isolated by inundation in adjacent areas.
Storm Surge Warning: The danger of life-threatening inundation from rising water moving inland from the shoreline somewhere within the specified area, generally within 36 hours, in association with an ongoing or potential tropical cyclone, a subtropical cyclone, or a post-tropical cyclone. The warning may be issued earlier when other conditions, such as the onset of tropicals uch as the onset of tropical stormforce winds, are expected to limit the time available to take protective actions for surge (e.g., evacuations). The warning may also be issued for locations not expected to receive life-threatening inundation, but which could potentially be isolated by inundation in adjacent areas.
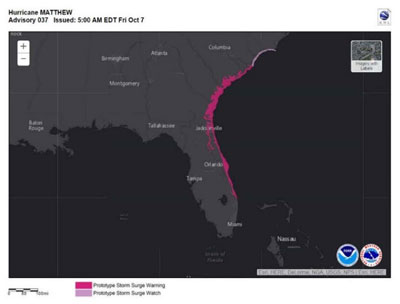
The new storm surge warnings and watches will be accompanied with an available graphic for each storm, in addition to the already available Potential Storm Surge Flooding Maps.
Here?s what the graphic will look like:

Issuance of Watches, Warnings, and Advisories for Potential Tropical Cyclones
Pending final NWS approval, in 2017, the NHC will have the option to issue advisories, watches, and warnings for disturbances that are not yet a tropical cyclone, but which pose the threat of bringing tropical storm or hurricane conditions to land areas within 48 hours.
Under previous longstanding NWS policy, it was not permitted to issue a hurricane or tropical storm watch or warning until after a tropical cyclone had formed. However, advances in forecasting over the past decade or so now allow the confident prediction of tropical cyclone impacts while these systems are still in the developmental stage. For these land-threatening ?potential tropical cyclones? NHC will now issue the full suite of text, graphical, and watch/warning products that previously has only been issued for ongoing tropical cyclones.
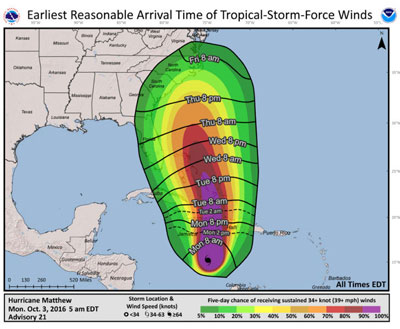
New Experimental ?Time of Arrival of Tropical-Storm-Force Winds? Graphic
The arrival of sustained tropical-storm-force winds is a critical planning threshold, as many preparedness activities ? like moving in deck furniture, tying down trash cans, and stocking up on beer – become difficult or dangerous once winds reach tropical storm force.
The NHC notes in its news release that frequently, this timing is estimated using the deterministic NHC track, intensity, and wind-field (size) forecasts, but such an approach doesn?t account for forecast uncertainty, and communities can be caught off guard if a storm speeds up or grows in size beyond what was forecast.
Island locals are well aware of this phenomenon.
Consider 2004?s Hurricane Alex, which lingered offshore as a tropical storm, and then sped up and brushed the Outer Banks as a high category 1. At the time, many of us were at work, or at Food Lion, or just driving around being looky-loos (while pretending to be at work), when suddenly the weather took a drastic turn for the worst, and we were stuck trying to get home safely, while not ruining our vehicles from saltwater flooding in the process.
The new graphics will display the ?earliest reasonable? arrival time, and will look a lot like the current storm prediction maps, with a graded scale of when to expect sustained tropical force winds. An example of what these maps will look like is below, and the hope is that by knowing when the winds will arrive, residents will be able to get everything squared away before the weather deteriorates.

Update to tropical cyclone advisory graphical products
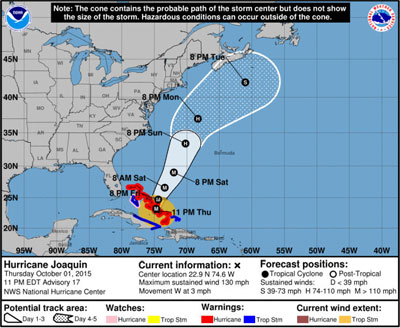
The NHC has also updated the look of its tropical cyclone advisory graphics for 2017.
The suite of graphics now has a consistent look across the board, with cleaner fonts and softer colors. (Everyone probably has an inherent mental image of the NHC maps, which have the bold green landmass, the blue ocean waters, and that stark white hurricane path that?s hopefully far, far away from the ?green? landmass section. Well, no more.)
In addition, instead of the skinny forecasted track, there will be also be an area that shows the extent of hurricane- and tropical-storm-force winds, (see the yellow area below), which will help illustrate that hazardous conditions can occur well outside of the track forecast cone.

Hopefully, none of us will have to worry about navigating these new maps, graphics and changes in the months to come. (I fully realize that this may be an unreasonable hope, but I?m knocking on wood regardless.)
But just in case you want to know what?s coming in the event that a storm makes an appearance – and we all begin the process of obsessively checking the NHC website for updates – you can view examples of all of the current and new graphics here: http://www.nhc.noaa.gov/aboutnhcgraphics.shtml.
The good news is that with more attention to storm surge and additional factors that affect our area ? like wind arrival times ? we?ll have a better chance at knowing what?s coming.
In the meantime, I hope you?ll join me in reviewing the new maps and graphics, and then looking forward to not having to worry about hurricanes and storms again for hopefully a very, very, very long time.


