DOT’s new plan for funding projects makes it hard for rural areas to compete
Citizens who want to understand what projects the state Department of Transportation is proposing to fund or not fund under its new Strategic Mobility Formula might need to first hone their mastery of puzzles and mazes.
What residents of northeastern North Carolina may miss in NCDOT’s unfathomable document posted online for review is that most – if not all – of the proposed transportation projects in Highway Division One that includes Dare, Hyde, and Currituck counties, rank low in priority – including the Mid-Currituck Bridge, the Alligator River bridge and widening US. 64 – and that the division’s guaranteed dollars are a sliver of its prior funding.
In fact, as the plan looks now, few major projects in the Northeast are likely to be built any time in the near future. Nearly 50 percent of total state transportation funds are slated for Division Five, which includes Wake County.
With priorities in the Mobility Formula focused mostly on factors like year-round traffic congestion and population density, projects in less populated areas are buried under the crowded urban regions’ pile of needs.
“This Board of Transportation is keenly aware of a whole-state philosophy,” said Malcolm Fearing, a Manteo resident who represents Division One on the board. “We are addressing and already looking at the rural and urban nature of our state. The question is: How do we fund it?”
Fearing said there is about $20 billion available statewide for transportation projects through 2025, but there is about $70 billion in today’s dollars worth of projects identified, leaving a $50 billion shortfall.
And it’s not like the northeast hasn’t gotten a share of the pie, he said. Currently, about $1 billion in highway projects are scheduled or under construction in Division One, he said, including work on Hatteras Island.
So it comes down to limited future highway funds –at least partly due to decreased revenue from gas taxes – that need to be applied strategically, Fearing said, adding that the process will be re-evaluated after a year.
“We’ll be dealing with a correction,” he said.
But it is doubtful that any member of the public will be able to understand what is at stake from looking at the Strategic Transportation documents. A mix of incomprehensible spreadsheets interspersed with indecipherable charts, unwieldy maps and confusing text, the information fails to make sense of the multi-layered, data-dense, fragmented and wholly head-spinning complexity of a process that is supposed to foster efficiency and revitalize communities.
Two public workshops were scheduled within the division for the public to give input, and comments will be taken into consideration in drafting the State Transportation Improvement Program, or STIP, said division planning engineer Gretchen Byrum. The STIP provides schedule and funding details on projects.
At the meeting held on Thursday, June 26, in Winton, Byrum said only one official from Hertford County attended the 3-hour open house. Another workshop is scheduled in Edenton for tomorrow — Tuesday, July 1.
Public comments will be accepted through July 23.
In previous budget years, according to DOT, Division One received $85 million to $120 million per year. Under the new prioritizing system, the division is guaranteed $27 million per year.
With much of the funding formula weighted in favor of high population regions, it appears that areas with fewer people qualify for fewer transportation dollars.
“In my personal opinion, it’s one of the worst things that has happened to rural North Carolina,” said Stan White, a former member for 10 years of the state Board of Transportation who is running to regain his District 1 senate seat from state Sen. Bill Cook.
White, who is from Nags Head, said that whether it’s the mountains or the coast, residents’ roads and bridges deserve to be as safe as those in traffic-plagued Charlotte and Raleigh.
“To say that their problems (in Charlotte or Raleigh) are more important than taxpayers in rural areas,” he said, “that’s what gets me.”
Passed in 2013, the Strategic Transportation Investments Law created a new formula for allocating funds that scored projects based on data and local input. The process will “maximize North Carolina’s existing transportation funding to enhance the state’s infrastructure and support economic growth, job creation and high quality of life,” according to the DOT website.
Initial data, the site said, indicates that the state will be able to schedule 196 additional projects over the next 10 years with existing funds.
Meanwhile, DOT will move forward with projects let before July 2015, which include bridges on Highway 12 on Hatteras Island. The Bonner Bridge replacement project over Oregon Inlet is funded and scheduled, but construction is stayed pending the outcome of a lawsuit.
Byrum said that the Rural Planning Organization, or RPO, and the division are in the process of prioritizing projects, based on the methodology they developed. The law bases funding for regional needs on 70 percent from data and 30 percent from local input, half of that from the RPO – which is divided in three parts and includes some counties bordering Division One. The other half of the local input comes from the division.
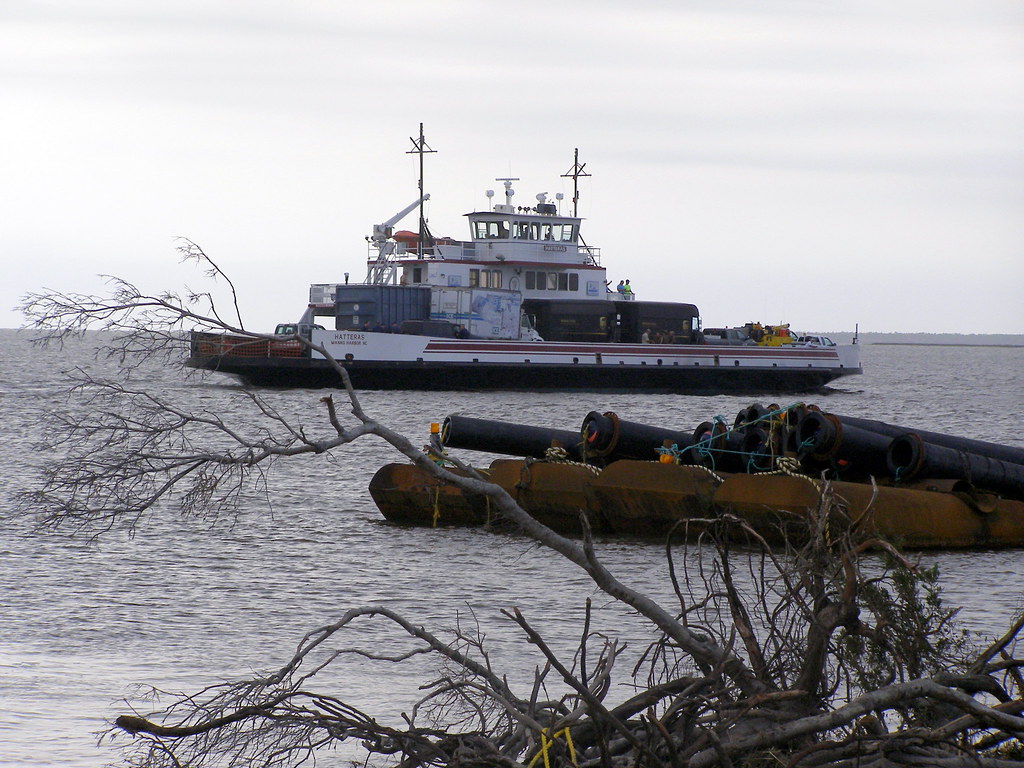
Not until the list of programmed projects is released this fall in the draft STIP will it be clear how the ferries have fared, Byrum said
Division One has to compete against Division Four for projects. But when one of the top point-getters are congestion and truck traffic, the division that includes Rocky Mount and Tarboro is bound to win more points than farming and fishing communities.
“It’s really hurt rural areas because they stand very little chance of meeting the criteria,” White said.
As for the division needs, the law provides 50 percent of the funds from data and 50 percent from the RPO and the division, each getting 25 percent.
No projects in Division One — Bertie, Camden, Chowan, Currituck, Dare, Gates, Hertford, Hyde, Martin, Northampton, Pasquotank, Perquimans, Washington and Tyrrell counties — qualified to be in the statewide category, which is 100 percent data-driven and includes interstate highways, routes in the national highway system, toll roads and highways that are vital to national defense.
Whatever projects are not funded in the statewide category will “cascade” down into the regional category, Byrum explained. And if they don’t make that category, they will move down into the division category. Somewhere along the process, those projects will have to be re-prioritized by division engineers.
Although Byrum agreed that the new formula could be hard to comprehend, she said that ultimately it is a different way of prioritizing projects that will be put in the STIP, the standard document that DOT has employed for years to schedule transportation projects for construction by division.
Public comment will be open on the draft STIP from December 2014 through May 2015.
“It’s supposed to take the local politics out of it, pretty much, and make it more data-driven,” she said. “It’s so detailed and there are so many different layers to it. I can see why the public can be confused.”
Under the new formula, each of the state’s 14 highway divisions is to be evaluated under three categories: statewide, regional, and division. Each category, in turn, has been allotted a certain percentage of available funds under numerous criteria, with highways getting 90 percent of funds, divided by values assigned to the criteria.
For example, here’s what it says about the “Regional Impact Category”:
“This category will receive 30 percent of available revenue. Projects on this level compete within regions made up of two NCDOT Transportation divisions, with funding divided among the regions based on population. Data makes up 70 percent of the project scores . . . Local rankings will account for the remaining 30 percent.”
Then, it continues, each of the category’s highway projects are divided in four criteria, each with a different value: congestion, 25 percent; benefit/cost, 25 percent; safety, 10 percent; accessibility/connectivity, 10 percent.
Every mode of transportation, from rail to bicycle to ferry to road to bridge, is parsed by rankings, criteria, values, regions, divisions, modes, U.S. highways, state highways, strategic military interests, toll routes, municipal and rural planning organizations, statewide impacts and shared resources.
Within the categories, modes of transportation, including ferries and bicycle paths, have a much smaller percentage of value that is calculated by points assigned to projects by a regional panel.
Out of the slew of data and analysis provided from the multitude of sources, division engineers established a draft Project Priority Ranking based on an application of qualitative points.
Some projects that scored high in the division, such as the proposed Mid-Currituck Bridge, did not qualify in the bigger picture.
“It wasn’t competitive statewide,” Byrum said. “Until the law is revised, that project is not meeting the statewide criteria.”
Another project that the division scored high was completion of N.C. 168 to Belcross, known by locals as the shortcut to Elizabeth City, and replacement of the bridge over Alligator River.
But some projects scored higher than the division’s score, including widening of U.S. 158 from Kitty Hawk to Manteo and the midway intersection in Manteo, neither of which are popular locally.
Whatever is proposed now in the transportation formula, Fearing cautioned, is not written in stone.
“It’s a new process,” he said. “We need to have a greater understanding of it and make adjustments as adjustments are needed.”
FOR MORE INFORMATION
Link to the Strategic Transportation Improvements Act:
http://www.ncdot.gov/strategictransportationinvestments/
Link to public meetings and public comment: http://www.ncdot.gov/strategictransportationinvestments/PublicMeetings.html
Link to Division One Methodology and Preliminary Scoring: https://connect.ncdot.gov/projects/planning/Pages/ResourcesMPO-RPO.aspx
Link to STI Fact Sheet: https://inside.ncdot.gov/SiteCollectionImages/Lists/NCDOT%20Senior%20
Management%20Announcements/NewForm/Strategic_Mobility_Formula_Fact_Sheet.pd


